The Art of Memory Forensics Chapter-01
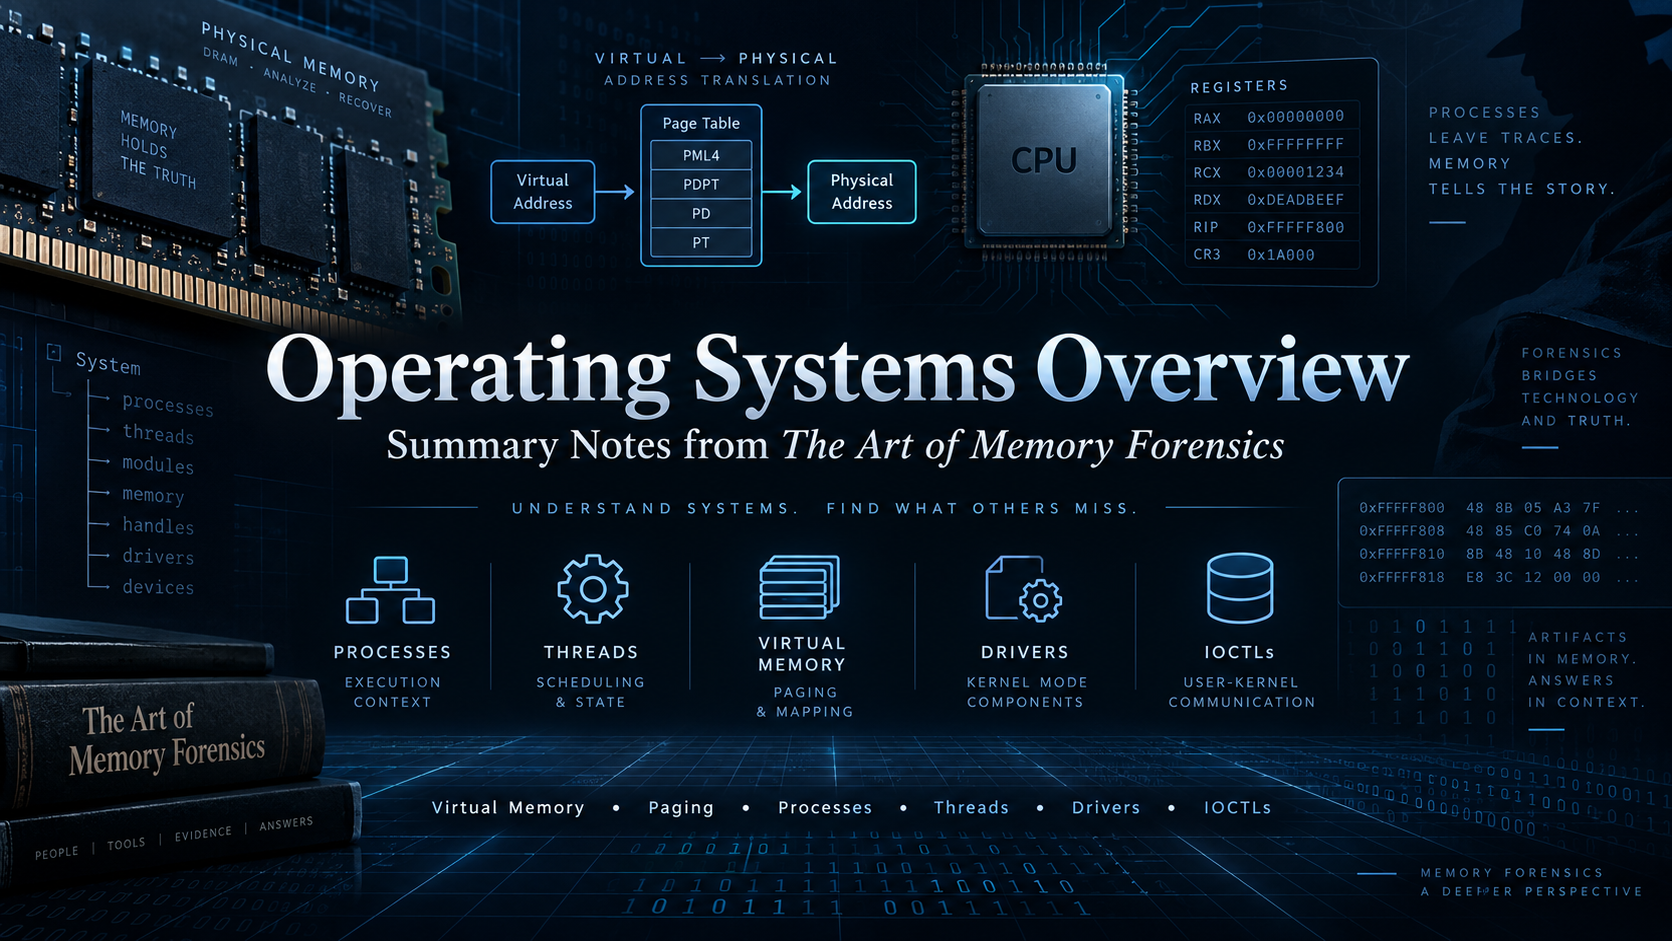
Brief notes summarizing Chapter 1 of The Art of Memory Forensics, with a focus on system overview and core operating system concepts.
ON THIS PAGE / 33 SECTIONS
- Digital Environment
- PC Architecture
- CPU (Central Processing Unit) & MMU (Memory Management Unit)
- North and Southbridge
- DMA (Direct Memory Access)
- Example:
- Volatile Memory (RAM)
- CPU Architectures
- Address Spaces
- 32 Architecture
- Registers
- Segmentation
- Paging
- 32 Architecture Address Translation Example:
- PAE (Physical Address Extension)
- Intel 64 Architecture
- 64 Architecture Address Translation Example:
- (IDT) Interrupt Descriptor Table
- Operating Systems
- Privilege Separation
- System Calls
- Process Management
- Threads
- CPU scheduling
- System Resources
- Virtual Memory
- Demand Paging
- Shared Memory
- Stacks and Heaps
- File System
- Device Drivers
- I/O Controls (IOCTLs)
- By the end of this chapter, we were able to understand some of the basic concepts and fundamental mechanisms of how an operating system works. I hope you found this chapter useful. If you notice any issues in the explanation or any incorrect concepts, please feel free to contact me. Thank you.
Digital Environment
A good digital investigator must understand how the underlying hardware and operating system work so they can correctly interpret digital artifacts, reconstruct events, and support or refute investigative hypotheses. This is similar to a physical crime-scene investigator who understands the laws of physics and can use evidence such as bloodstain or blood-splatter patterns to determine whether a claimed sequence of events is physically possible or not.
PC Architecture
A PC consists of interconnected hardware components, with the motherboard acting as the main communication hub and computer buses providing the pathways through which those components exchange data.
CPU (Central Processing Unit) & MMU (Memory Management Unit)
The CPU executes instructions, while main memory temporarily stores the running programs and their data. The CPU repeatedly accesses memory to fetch instructions and data, then executes those instructions.
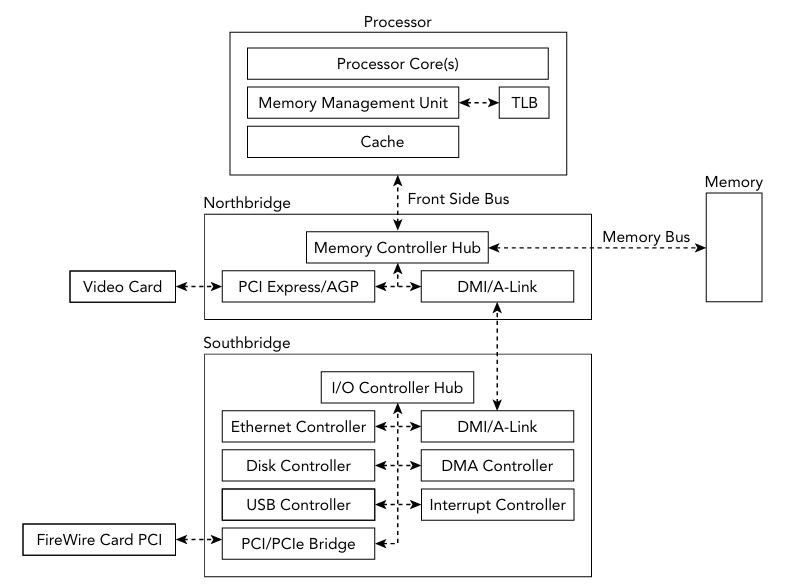
Because main memory is much slower than the CPU, modern processors use multiple levels of cache memory to keep frequently needed data close to the CPU. L1 is the fastest and smallest, while subsequent cache levels are larger but slower. On a cache miss, the processor searches the next cache level and eventually main memory.
The MMU translates processor-requested addresses into physical memory addresses, while the TLB caches recent address translations to avoid repeatedly performing expensive translation operations.
North and Southbridge
Older systems used a northbridge to connect the CPU to RAM and a southbridge to manage I/O devices. In modern systems, the memory controller is usually integrated into the CPU, while the remaining I/O-related chipset functions are handled by the Platform Controller Hub (PCH).
DMA (Direct Memory Access)
DMA allows I/O devices to transfer data directly to or from physical memory without requiring continuous CPU intervention. This improves performance and is important in memory forensics because it can provide direct access to RAM without relying on potentially compromised software or the operating system running on the target machine.
Example:
Suppose the physical memory actually contains:

Process A | Process B | Malware X | Process C

If Malware X has compromised the operating system, it may manipulate or hide information that OS-based forensic tools rely on. As a result, a forensic tool running through the compromised OS might only see:

Process A | Process B | Process C

while Malware X remains hidden from normal process listings or other operating system structures.

By using a DMA-capable device, an investigator may access physical memory more directly and reduce reliance on the potentially compromised operating system. This can increase the chance of identifying hidden artifacts, including Malware X, that may not appear through normal OS-based acquisition methods.
Volatile Memory (RAM)
RAM stores the code and data currently being used by the CPU. Most systems use DRAM, which stores bits using capacitors that must be periodically refreshed. RAM is volatile, meaning its contents are normally lost when power is removed. Therefore, in memory forensics, shutting down or unplugging a live system can destroy valuable volatile evidence such as running processes, network connections, and other runtime data.
CPU Architectures
Understanding CPU architecture is important in memory forensics because tools such as Volatility must understand the system’s logical memory model to translate virtual addresses into physical memory and correctly reconstruct operating system structures.
Address Spaces
An address space is the range of valid memory addresses. Programs usually operate using linear or virtual addresses, while the CPU ultimately accesses RAM using physical addresses. Page tables translate the virtual address into the corresponding physical address. For example, a program may use Virtual Address = 0x400000, while after address translation the actual location in RAM may be Physical Address = 0x1A3000.
32 Architecture
IA-32 is Intel’s 32-bit x86 architecture. It uses byte addressing and little-endian byte order, and normally provides up to a 4 GB linear address space. With PAE, the system can address up to 64 GB of physical memory. IA-32 operating systems commonly use protected mode, which provides paging, virtual memory, segmentation, and privilege levels.
Registers
Registers are very small and extremely fast memory locations inside the CPU. In this context, there are two important types:
General-purpose registers: such as EAX, EBX, ECX, EDX, ESI, EDI, EBP, ESP, used for temporary data, calculations, addresses, and stack operations.
Special/control registers: used to control CPU behavior and memory management.
Important special registers:
- EIP: stores the address of the next instruction.
- CR0: controls processor features such as paging.
- CR2: stores the address that caused a page fault.
- CR3: points to the paging structures used for virtual-to-physical address translation.
- CR4: enables features such as PAE.
Example: If a process accesses a virtual address, the CPU uses CR3 to find the page tables and translate it to a physical address. If the access causes a page fault, that virtual address is stored in CR2.
Segmentation
Segmentation divides memory logically into segments. The CPU uses a segment selector to choose the required segment and an offset to choose a specific location inside that segment. The segment descriptor provides the segment’s base address, size, type, and permissions. The result is a linear address, which can then be translated by paging into a physical address.
Simple workflow:
- Segment Selector + Offset
- Segment Descriptor
- Base Address + Offset
- Linear Address
- Paging
- Physical Address
Paging
Paging allows each process to use a continuous virtual address space, even if its data is scattered across different locations in physical RAM.
In IA-32, virtual memory is divided into fixed-size pages, commonly 4 KB. When a process accesses a virtual address, the MMU translates it into a physical address using the paging structures.
For a 4 KB page, the 32-bit virtual address is divided into:
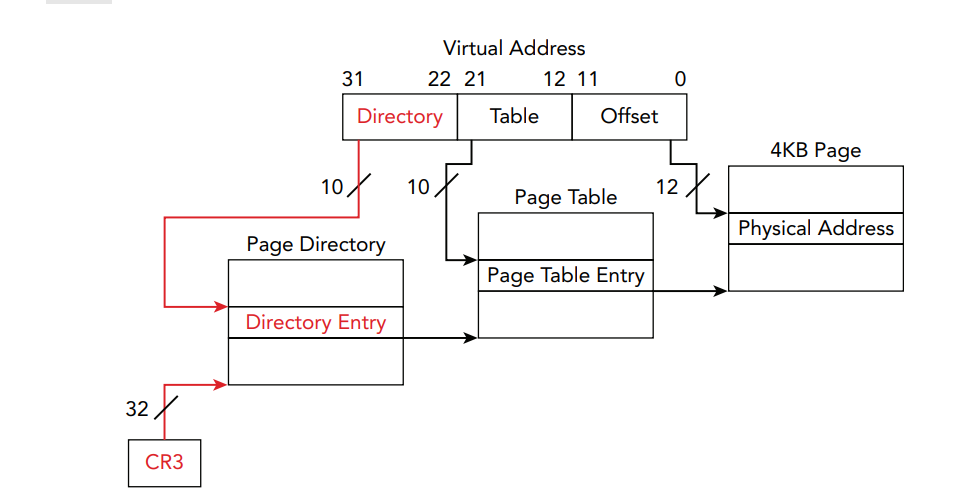
The translation flow is:
Virtual Address + CR3 → PDE → PTE → Physical Page + Offset → Physical Address
Example:
A process may access:
Virtual Address = `0x00401234`
and its page tables may map it to:
Physical Address = `0x12000234`
Another process may use the same virtual address:
Virtual Address = `0x00401234`
but map it to a different physical address.
This happens because each process normally has its own paging structures, and the CR3 register points to the paging hierarchy of the currently executing process.
32 Architecture Address Translation Example:
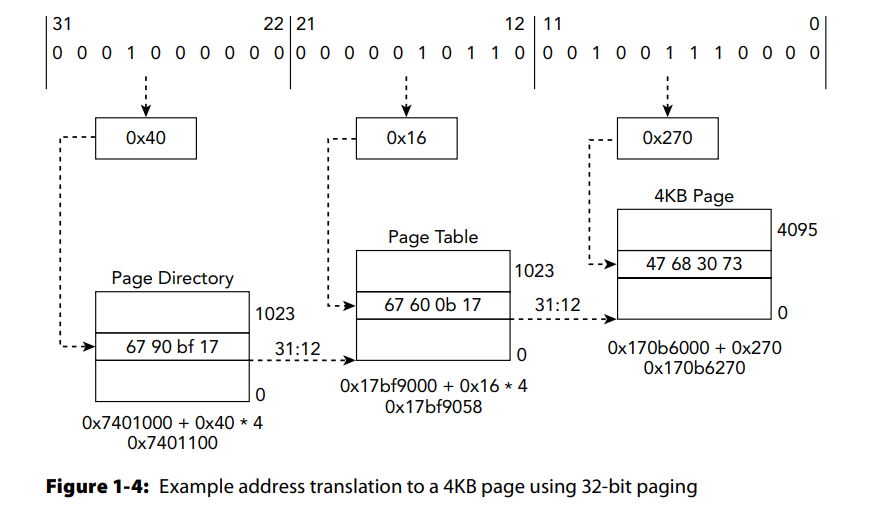
In the simple lab named ENG-USTXHOU-148, you will find the process svchost.exe with PID 1024. The process has a virtual address of 0x10016270, and its CR3 (or DTB) value is 0x7401000. We are asked to calculate the corresponding physical address so that we can examine the process data stored in physical memory.
First, we need to convert the virtual address (VA) from hexadecimal to binary so we can divide it into the directory index, page table index, and offset bits.
Virtual Address (0x10016270) = 0001 0000 0000 0001 0110 0010 0111 0000
| Paging Structure | VA Bits | Binary | Hex |
|---|---|---|---|
| Page directory index | Bits 31:22 | 0001000000 | 0x40 |
| Page table index | Bits 21:12 | 0000010110 | 0x16 |
| Address offset | Bits 11:0 | 001001110000 | 0x270 |
To calculate the PDE address in physical memory, we use the page directory index from bits 31:22 of the virtual address, multiply it by 4 bytes (the size of each PDE), and add the result to the CR3 value.
Physical PDE Address = (0x40 * 4) + 0x7401000 = 0x7401100
If we look at the value 0x7401100 in memory and read the 4 bytes in little-endian format, we obtain the PDE value:
PDE Value = 0x17BF9067
To get the base address of the Page Table, we clear the last 3 hexadecimal digits (the lower 12 bits), because they contain flags:
0x17BF9067 → 0x17BF9000
Then we use this Page Table base address to calculate the PTE address.
To calculate the PTE address, we take the Page Table base address obtained from the PDE, multiply the Page Table Index from the virtual address by 4 bytes, and then add the result to the Page Table base.
PTE Address = (0x16 * 4) + 0x17BF9000 = 0x17BF9058
If we look at the address 0x17BF9058 in the physical memory image and read the 4 bytes in little-endian format, we obtain the PTE value:
PTE = 0x170B6067
After clearing the lower 12 bits that contain the flags, we get the base address of the physical page:
Physical Page Base = 0x170B6000
To obtain the final Physical Address, we add the address offset from the virtual address directly to the physical page base:
Physical Address = 0x170B6000 + 0x270 = 0x170B6270
Virtual Address = 0x10016270
Physical Address = 0x170B6270
Look at the Next image to understand the steps.
PAE (Physical Address Extension)
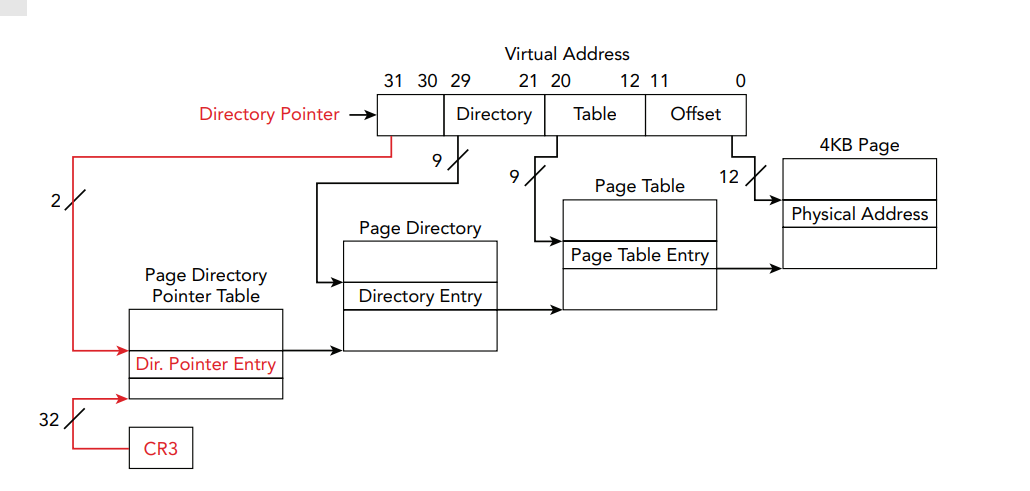
PAE allows a 32-bit IA-32 processor to address up to 64 GB of physical memory, while each process still has a maximum 4 GB linear/virtual address space.
PAE adds an extra paging level called the PDPT, uses 64-bit paging entries, and splits the 32-bit virtual address into 2 + 9 + 9 + 12 bits.
Intel 64 Architecture
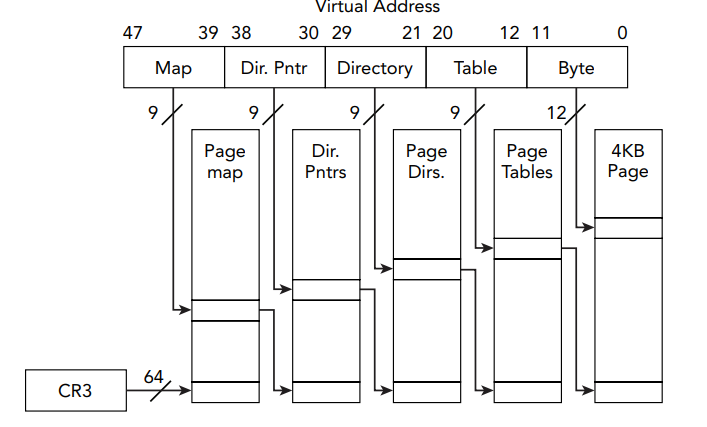
Intel 64 expands the registers to 64 bits and supports 64-bit linear addressing. In the implementation discussed here, only 48 bits of the virtual address are used. Therefore, bits 63:48 must copy bit 47: all 0s if bit 47 is 0, or all 1s if bit 47 is 1 (canonical addressing). Intel 64 also adds the PML4 paging level and supports 4 KB, 2 MB, and 1 GB pages.
64 Architecture Address Translation Example:
Virtual Address (0x00007F123456789A) = 0111 1111 0001 0010 0011 0100 0101 0110 0111 1000 1001 1010
| Paging Structure | VA Bits | Binary | Hex |
|---|---|---|---|
| PML4 index | Bits 47:39 | 011111110 | 0xFE |
| PDPT index | Bits 38:30 | 001001000 | 0x48 |
| Page directory index | Bits 29:21 | 110100010 | 0x1A2 |
| Page table index | Bits 20:12 | 101100111 | 0x167 |
| Address offset | Bits 11:0 | 100010011010 | 0x89A |
To calculate the PML4E address in physical memory, we use the PML4 index from bits 47:39 of the virtual address, multiply it by 8 bytes (the size of each 64-bit paging entry), and add the result to the CR3 value.
PML4E Address = (0xFE * 8) + 0x12345000 = 0x123457F0
If we look at the address 0x123457F0 in physical memory and read the 8 bytes in little-endian format, assume we obtain the PML4E value:
PML4E = 0x0000000023456003
After clearing the lower 12 bits that contain the flags, we get the base address of the Page Directory Pointer Table:
PDPT Base = 0x23456000
To calculate the PDPTE address, we multiply the PDPT index from the virtual address by 8 bytes and add the result to the PDPT base.
PDPTE Address = (0x48 * 8) + 0x23456000 = 0x23456240
If we read the 8 bytes at 0x23456240, assume we obtain:
PDPTE = 0x0000000034567003
After clearing the lower 12 bits, we get the Page Directory base:
Page Directory Base = 0x34567000
To calculate the PDE address, we multiply the Page Directory Index by 8 bytes and add the result to the Page Directory base.
PDE Address = (0x1A2 * 8) + 0x34567000 = 0x34567D10
If we read the 8 bytes at 0x34567D10, assume we obtain:
PDE = 0x0000000045678003
After clearing the lower 12 bits, we get the Page Table base:
Page Table Base = 0x45678000
To calculate the PTE address, we multiply the Page Table Index by 8 bytes and add the result to the Page Table base.
PTE Address = (0x167 * 8) + 0x45678000 = 0x45678B38
If we read the 8 bytes at 0x45678B38, assume we obtain:
PTE = 0x0000000056789003
After clearing the lower 12 bits that contain the flags, we get the base address of the physical page:
Physical Page Base = 0x56789000
To obtain the final Physical Address, we add the address offset from the virtual address directly to the physical page base:
Physical Address = 0x56789000 + 0x89A = 0x5678989A
Virtual Address = 0x00007F123456789A
Physical Address = 0x5678989A
(IDT) Interrupt Descriptor Table
The IDT is a table that maps interrupt and exception vector numbers to their corresponding handlers. When an interrupt or exception occurs, the CPU uses the vector number to locate the appropriate IDT entry, executes the handler, and may then resume the interrupted execution.
Operating Systems
Privilege Separation
Privilege separation is enforced by the IA-32 architecture using four protection rings, numbered from Ring 0 to Ring 3. Ring 0 is the most privileged level and is typically used by the operating system kernel, while Ring 3 is the least privileged level and is used by normal user applications. Rings 1 and 2 provide intermediate privilege levels but are rarely used by modern operating systems. When a user application needs to perform a privileged operation, it uses a system call to transfer control from Ring 3 to Ring 0, after which control returns to user mode.
System Calls
A system call allows a user-mode application to request services from the kernel. Applications usually access system calls through APIs such as kernel32.dll and ntdll.dll. The call switches execution from Ring 3 to Ring 0, the kernel handles the request, then control returns to user mode. Because this interface is critical, it is often monitored by security tools and targeted by malware hooks.
Process Management
A process is an instance of a program executing in memory. Each process has its own PID, address space, resources, and at least one thread. The operating system manages process creation, execution, suspension, and termination. In memory forensics, analysts enumerate running processes and examine their address spaces for artifacts such as passwords, URLs, encryption keys, emails, and chat data.
Threads
A thread is the basic unit of CPU execution. Each thread has its own ID, registers, and stack, but threads within the same process share the same code, data, address space, and resources. In memory forensics, thread start addresses and timestamps can help identify what code executed and when.
CPU scheduling
CPU scheduling determines which thread executes and for how long. Switching from one thread to another is called a context switch. During a context switch, the operating system saves the current thread’s CPU register state in memory and restores another thread’s state. In memory forensics, these saved contexts can reveal what code was executing and what parameters were being used.
System Resources
Operating systems track the resources used by processes, such as files, sockets, threads, and shared memory. Windows uses handles managed by the Object Manager, while Linux and macOS use file descriptors. In memory forensics, examining these tables can reveal which resources a process was accessing and provide insight into its activity.
Virtual Memory
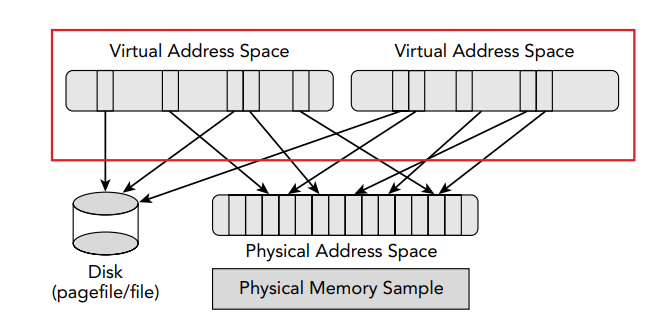
Each process has its own private virtual address space, which separates the memory seen by the process from the actual physical RAM. Not all virtual pages must be resident in physical memory; some may be moved to secondary storage, such as the Windows paging file (C:\pagefile.sys), to free space in RAM. When the process accesses a page that is no longer resident in RAM, a page fault occurs and the operating system brings the page back from secondary storage. The MMU and memory manager translate virtual addresses to physical addresses.
Demand Paging
Demand paging is a virtual memory technique in which the operating system loads only the pages that are actually needed into RAM, while other pages remain in secondary storage such as a page file or swap. If a thread accesses a non-resident page, a page fault occurs and the operating system loads the required page into memory. Demand paging improves memory efficiency, but in memory forensics it can result in missing data because some pages may not be present in RAM when the memory image is acquired.
Shared Memory
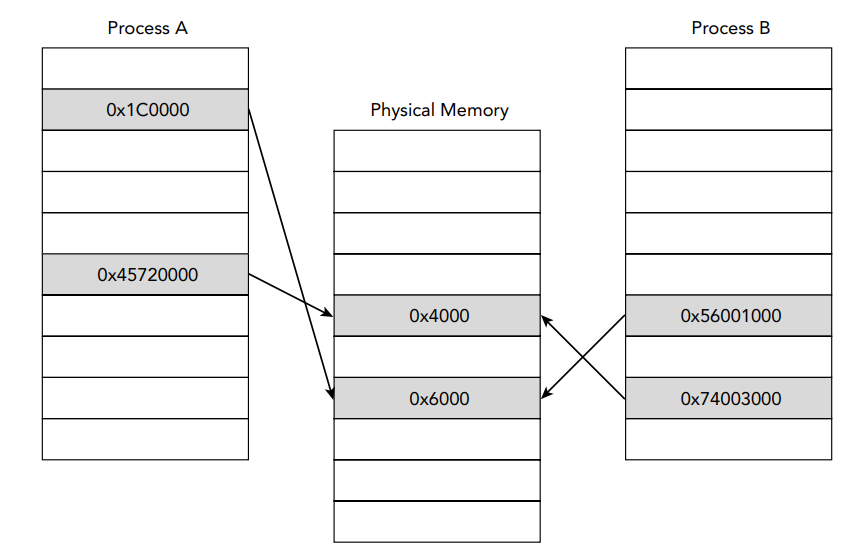
Shared memory allows multiple processes to map different virtual addresses to the same physical memory pages. It is commonly used for inter-process communication and to reduce memory usage by sharing common code and libraries. Shared pages are often implemented using copy-on-write, where a private copy is created only when a process modifies the shared page. In memory forensics, differences in shared library pages may indicate malicious modification or code injection. Chapter 17 provides an example of how these discrepancies can be detected by comparing memory shared between multiple processes.
Stacks and Heaps
The stack stores temporary data associated with function execution, including parameters, local variables, and information required to return to previous stack frames. Stack frames are pushed when functions are called and popped when they return. Operating systems typically maintain separate user-mode and kernel-mode stacks. In memory forensics, stack analysis can reveal which functions were executing, what parameters were passed, and what data malware was processing.
The heap stores dynamically allocated data whose size or lifetime may not be known at compile time. Heap data may include file contents, network data, keyboard input, and other application-specific information. Windows also uses kernel memory pools, including paged and nonpaged pools. Because heap contents are application-dependent, forensic analysis may require manual inspection using tools such as hex editors or string extraction.
File System
The file system stores persistent data on nonvolatile secondary storage, while the operating system loads and caches file data in memory when needed. Memory-mapped files allow file contents to be mapped directly into a process’s virtual address space. In memory forensics, cached or mapped file data can reveal recently accessed files, process activity, and differences between memory-resident data and the version stored on disk. Memory artifacts can also exist on disk in files such as crash dumps and hibernation files.
Device Drivers
Device drivers provide an interface between the operating system and hardware devices. They communicate with device controllers and registers, sometimes through memory-mapped I/O (MMIO), where device memory or registers are mapped into an address space and accessed like memory. Drivers are important in memory forensics because malicious software may abuse them to modify system state or gain kernel-level access. Some operating systems also expose software devices representing physical memory, which have been used for memory acquisition. Device memory mappings can also affect how physical memory is collected and interpreted.
I/O Controls (IOCTLs)
IOCTLs allow user-mode applications to communicate with kernel-mode device drivers using driver-specific control codes. Drivers can define their own IOCTL interfaces and functionality. Malware may abuse IOCTL handlers to communicate between user-mode and kernel-mode components, modify system behavior, elevate privileges, or hide activity. Memory forensics can help identify modified or suspicious IOCTL handlers.
By the end of this chapter, we were able to understand some of the basic concepts and fundamental mechanisms of how an operating system works. I hope you found this chapter useful. If you notice any issues in the explanation or any incorrect concepts, please feel free to contact me. Thank you.
Keep the investigation open.
Have another interpretation, a correction, or a useful trace? Reach out on Discord.
Continue on Discord